Is application reliability keeping you up at night?
New modern application stack technology and continuous deployments make it more challenging to measure digital business success.
Innovation acceleration
Organizations must increase their rate of innovation to stay competitive in the market. The added pressure stretches resources thin and companies struggle to keep up.
Critical outages
Business-critical application outages impact revenue and brand reputation. Slow resolution times compound issues affecting key performance metrics throughout the business.
Lack of visibility into application reliability and performance and business results
It’s difficult to justify additional resources without the clear insights and ROI from application modernization.
Complex ephemeral environments using Open Source
Managing application reliability and incidents without the right tools consume more developer time that slow down the project.
Sumo Logic enables operations teams to modernize applications
Application Observability
Reduce downtime and solve customer-impacting issues faster with an integrated observability platform for all of your application data including logs, metrics, and traces across the entire development lifecycle.

Kubernetes Monitoring

Your application modernization starts here
Increased visibility across your entire modern application stack to enable you to succeed in a digital environment.
Unified application observability for faster innovation
Single source of truth provides faster troubleshooting so you can prioritize more resources to accelerate feature releases and decrease outages.
Faster MTTR with unified telemetry
Using a unified platform to ingest, analyse and correlate all application and infrastructure telemetry allows DevOps teams to quickly identify, diagnose and resolve application incidents.
Comprehensive visibility across the cloud
Cloud centric views across multi-cloud deployments surface underperforming infrastructure and services across accounts, regions and application teams.
Measure the business impact of your modernization efforts
Track the performance of new capabilities and get real time insights on business KPIs associated with them.
Sumo Logic application observability capabilities
Sumo Logic empowers operations teams to modernize applications to manage the reliability and deliver new differentiated capabilities faster.
Custom dynamic dashboards with auto-discovery
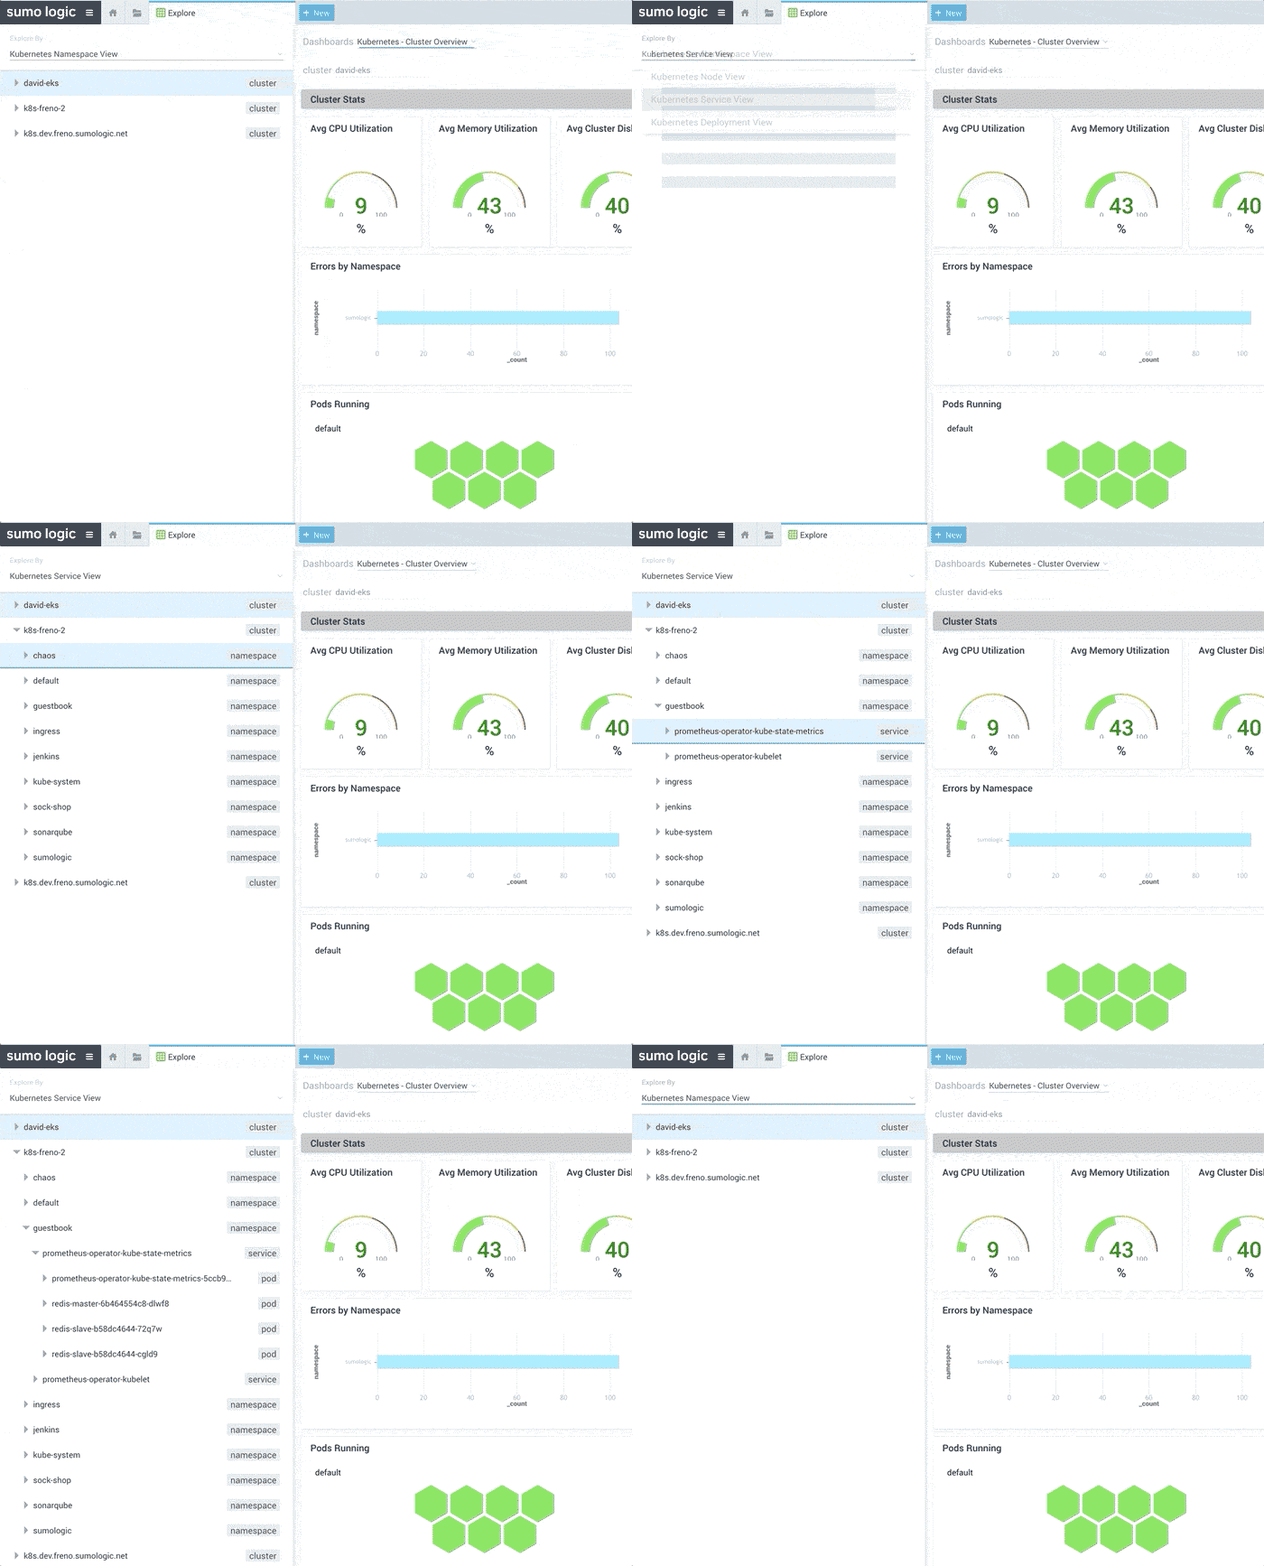
Modern, cross-functional site reliability and platform teams can’t afford to miss anything when solving a problem. Sumo Logic provides native integrations with best practice data sources for Kubernetes—Prometheus, OpenTelemetry, FluentD, Fluentbit, and Falco. With the easy to setup collection deployed using Helm, you get instant visibility to Performance Metrics, Logs, Traces, Kubernetes System Events, as well as Kubernetes Security Events. Our solution works for any Kubernetes setup, anywhere—on premise, AWS, Azure, and GCP.


Application service map & dashboards
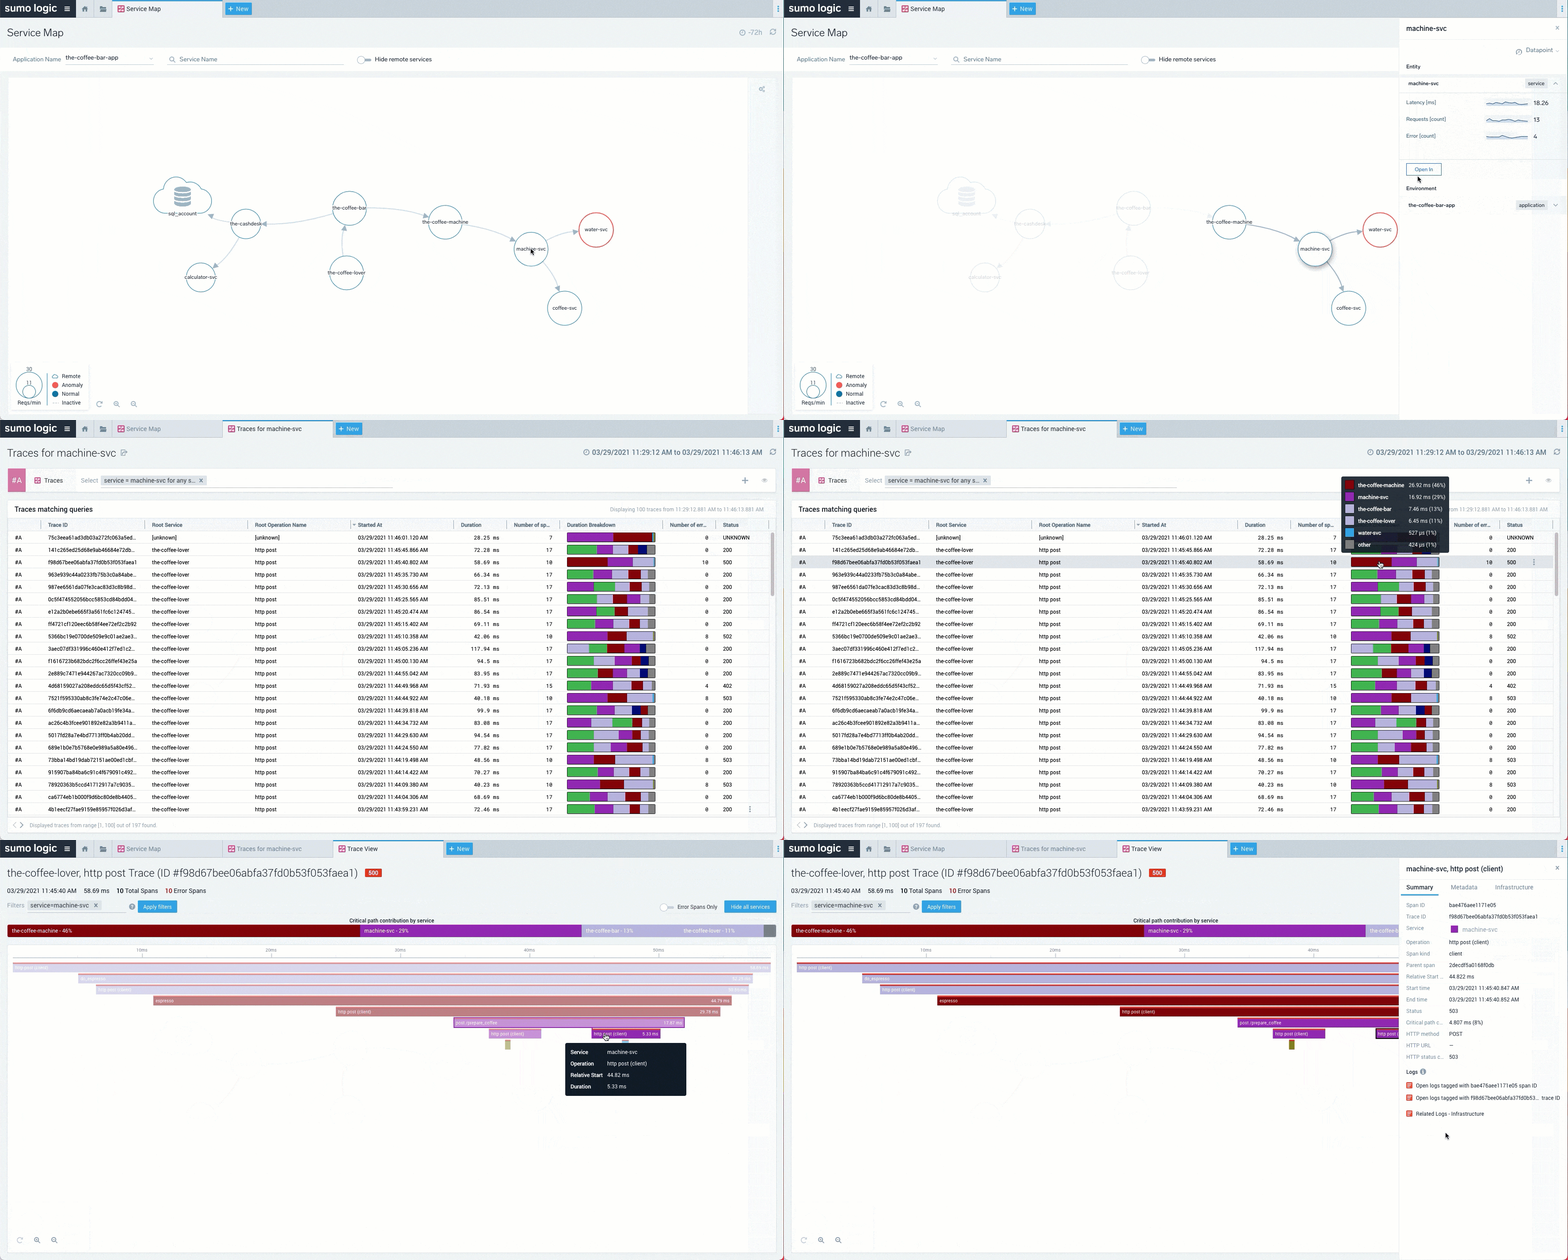
Sumo Logic visualizes all service dependencies to get insights into end to end execution of your business critical transactions with open standard compatible distributed tracing data. Application and service dashboards break down latency, load and errors to identify services contributing to application slowdowns.
Advanced alert analytics
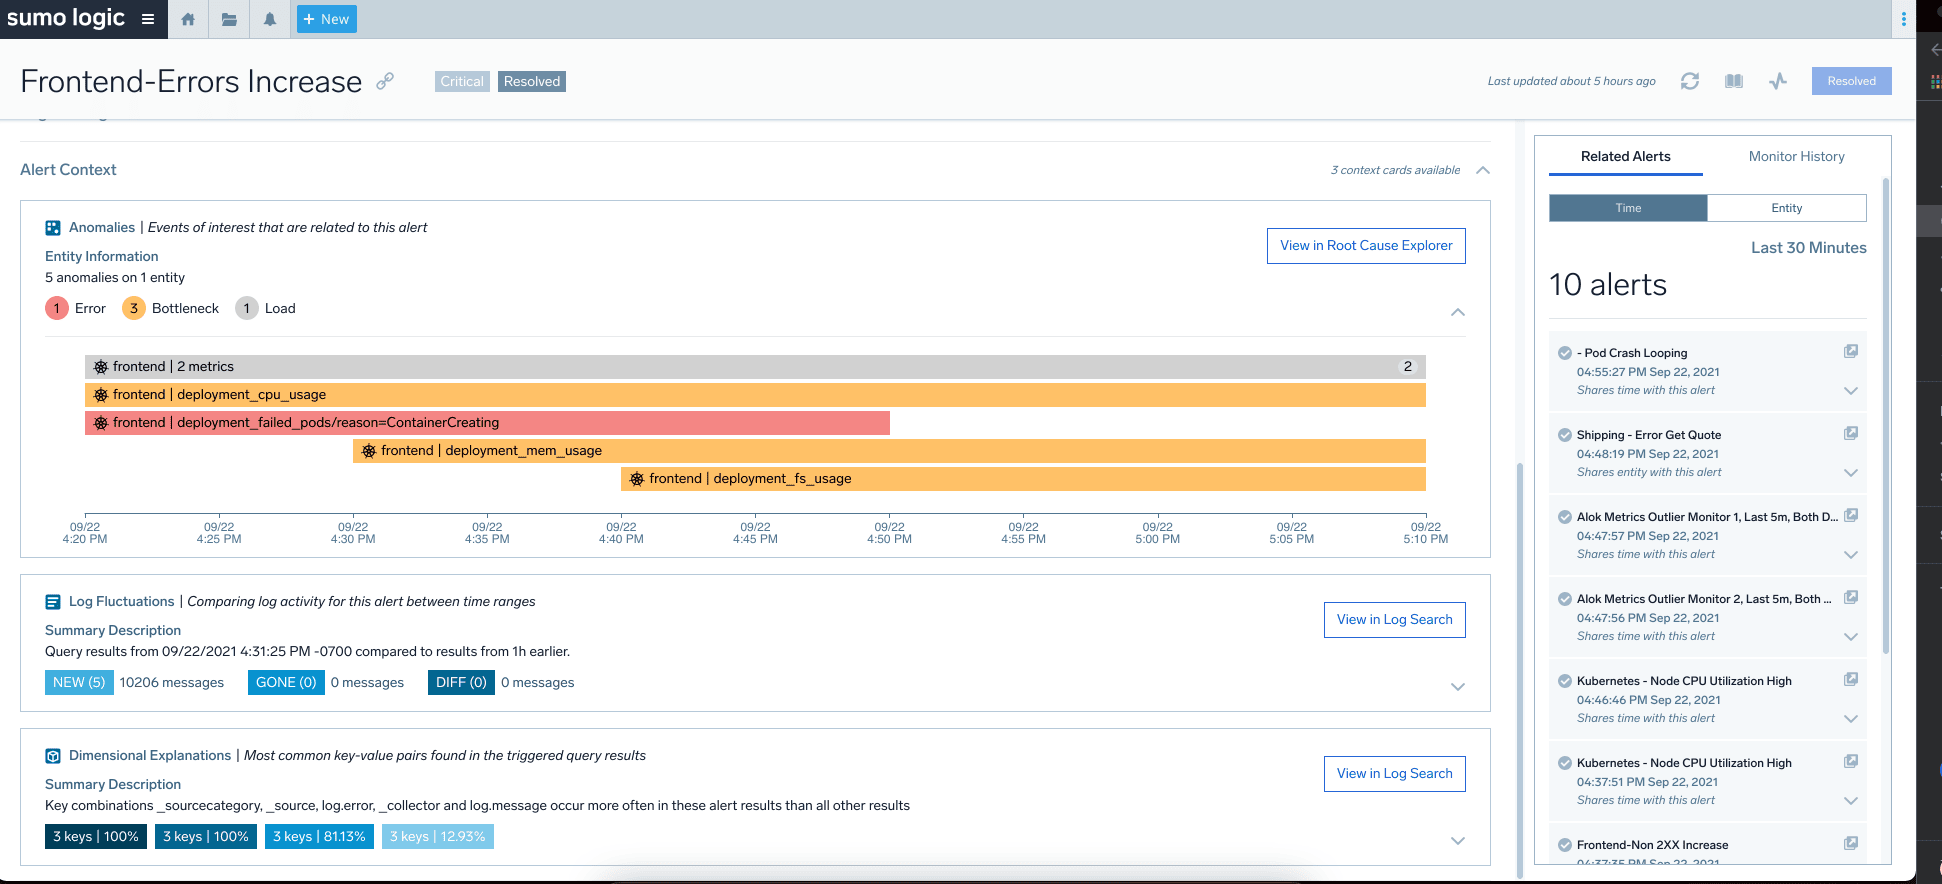
Sumo Logic helps observers and on-call teams reduce MTTR by simplifying the work required to validate issues, identify suspects, and quickly remediate. Leveraging powerful AI/ML, advanced analytics are applied across a unified repository of telemetry data to surface noteworthy insights that guide on-call teams to the root cause.


Cloud-native architecture
Sumo Logic makes it fast and easy to manage an organization’s digital transformation projects—from cloud migration and integration innovation to infrastructure redesign and anything in between.
Entity-driven workflows
Sumo Logic’s new entity driven workflows and embedded entity model, you have the ability to follow that spike to the source application or infrastructure component and get an inline peek at the health of that entity and related infrastructure the entity sits on.


