Docker is hard.
Don’t get me wrong. It’s not the technology itself that is difficult…It’s the learning curve. Committing to a Docker-based infrastructure means committing to a new way of thinking, which can be a harsh adjustment from the traditional thinking behind bare metal and virtualized servers.
Because of Docker’s role-based container methodology, simple things like log management can seem like a bear to integrate. Thankfully, as with most things in tech, once you wrap your head around the basics, finding the solution is simply a matter of perspective and experience.
Collecting Logs
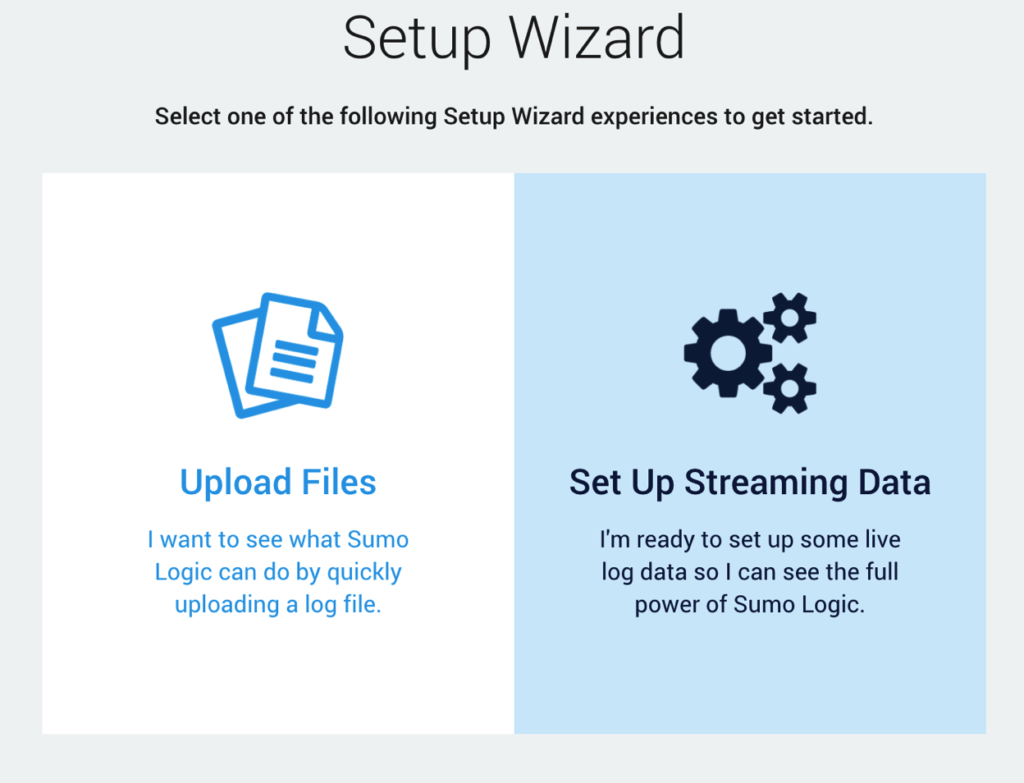
When it comes to aggregating Docker logs in Sumo Logic, the process starts much like any other: Add a Collector. To do this, open up the Sumo Logic Collection dashboard and open up the Setup Wizard.

Because we will be aggregating logs from a running Docker container, rather than uploading pre-collected logs, select the Set Up Streaming Data option in the Setup Wizard when prompted.

Next up, it is time to select the data type. While Docker images can be based on just about any operating system, the most common base image—and the one used for this demonstration—is Linux-based.

After selecting the Linux data type, it’s time for us to get into the meat of things. At this point, the Setup Wizard will present us with a script that can be used to install a Collector on a Linux system.

The Dockerfile
While copying and pasting the above script is generally all that is required for a traditional Linux server, there are some steps required to translate it into a Docker-friendly environment. To accomplish this, let’s take a look at the following Dockerfile:
<strong>FROM</strong> ubuntu
<strong>RUN</strong> apt-get update
<strong>RUN</strong> apt-get install -y wget nginx
<strong>CMD</strong> /etc/init.d/nginx start && tail -f /var/log/nginx/access.log
That Dockerfile creates a new container from the Ubuntu base image, installs NGINX, and then prints the NGINX access log to stdout (which allows our Docker image to be long-running). In order to add log aggregation to this image, we need to convert the provided Linux Collector script into Docker-ese. By replacing the sudo and && directives with RUN calls, you’ll end up with something like this:
<strong>RUN</strong> wget "https://collectors.us2.sumologic.com/rest/download/linux/64" -O SumoCollector.sh
<strong>RUN</strong> chmod +x SumoCollector.sh
<strong>RUN</strong> ./SumoCollector.sh -q -Vsumo.token_and_url=b2FkZlpQSjhhcm9FMzdiaVhBTHJUQ1ZLaWhTcXVIYjhodHRwczovL2NvbGxlY3RvcnMudXMyLnN1bW9sb2dpYy5jb20=
Additionally, while this installs the Sumo Logic Linux Collector, what it does not do is start up the Collector daemon. The reason for this goes back to Docker’s “one process per container” methodology, which keeps containers as lightweight and targeted as possible.
While this is the “proper” method in larger production environments, in most cases, starting the Collector daemon alongside the container’s intended process is enough to get the job done in a straightforward way. To do this, all we have to do is prefix the /etc/init.d/nginx start command with a /etc/init.d/collector start && directive.
When all put together, our Dockerfile should look like this:
<strong>FROM</strong> ubuntu
<strong>RUN</strong> apt-get update
<strong>RUN</strong> apt-get install -y wget nginx
<strong>RUN</strong> wget "https://collectors.us2.sumologic.com/rest/download/linux/64" -O SumoCollector.sh
<strong>RUN</strong> chmod +x SumoCollector.sh
<strong>RUN</strong> ./SumoCollector.sh -q -Vsumo.token_and_url=b2FkZlpQSjhhcm9FMzdiaVhBTHJUQ1ZLaWhTcXVIYjhodHRwczovL2NvbGxlY3RvcnMudXMyLnN1bW9sb2dpYy5jb20=
<strong>CMD</strong> /etc/init.d/collector start && /etc/init.d/nginx start && tail -f /var/log/nginx/access.log
Build It
If you’ve been following along in real time up to now, you may have noticed that the Set Up Collection page hasn’t yet allowed you to continue on to the next page. The reason for this is that Sumo Logic is waiting for the Collector to get installed. Triggering the “installed” status is as simple as running a standard docker build command:
docker build -t sumologic_demo .

Run It
Next, we need to run our container. This is a crucial step because the Setup Wizard process will fail unless the Collector is running.
docker run -p 8080:80 sumologic_demo

Configure the Source
With our container running, we can now configure the logging source. In most cases, the logs for the running process are piped to stdout, so unless you take special steps to pipe container logs directly to the syslog, you can generally select any log source here. /var/log/syslog is a safe choice.

Targeted Collection
Now that we have our Linux Collector set up, let’s actually send some data up to Sumo Logic with it. In our current example, we’ve set up a basic NGINX container, so the easiest choice here is to set up an NGINX Collector using the same Setup Wizard as above. When presented with the choice to set up the Collection, choose the existing Collector we just set up in the step above.

Viewing Metrics
Once the Collectors are all set up, all it takes from here is to wait for the data to start trickling in. To view your metrics, head to your Sumo Logic dashboard and click on the Collector you’ve created.

This will open up a real-time graph that will display data as it comes in, allowing you to compare and reduce the data as you need in order to identify trends from within your running container.

Next Steps
While this is a relatively simplistic example, it demonstrates the potential for creating incredibly complex workflows for aggregating logs across Docker containers. As I mentioned above, the inline collector method is great for aggregating logs from fairly basic Docker containers, but it isn’t the only—or best—method available. Another more stable option (that is out of the scope of this article) would be using a dedicated Sumo Logic Collector container that is available across multiple containers within a cluster. That said, this tutorial hopefully provides the tools necessary to get started with log aggregation and monitoring across existing container infrastructure.


